
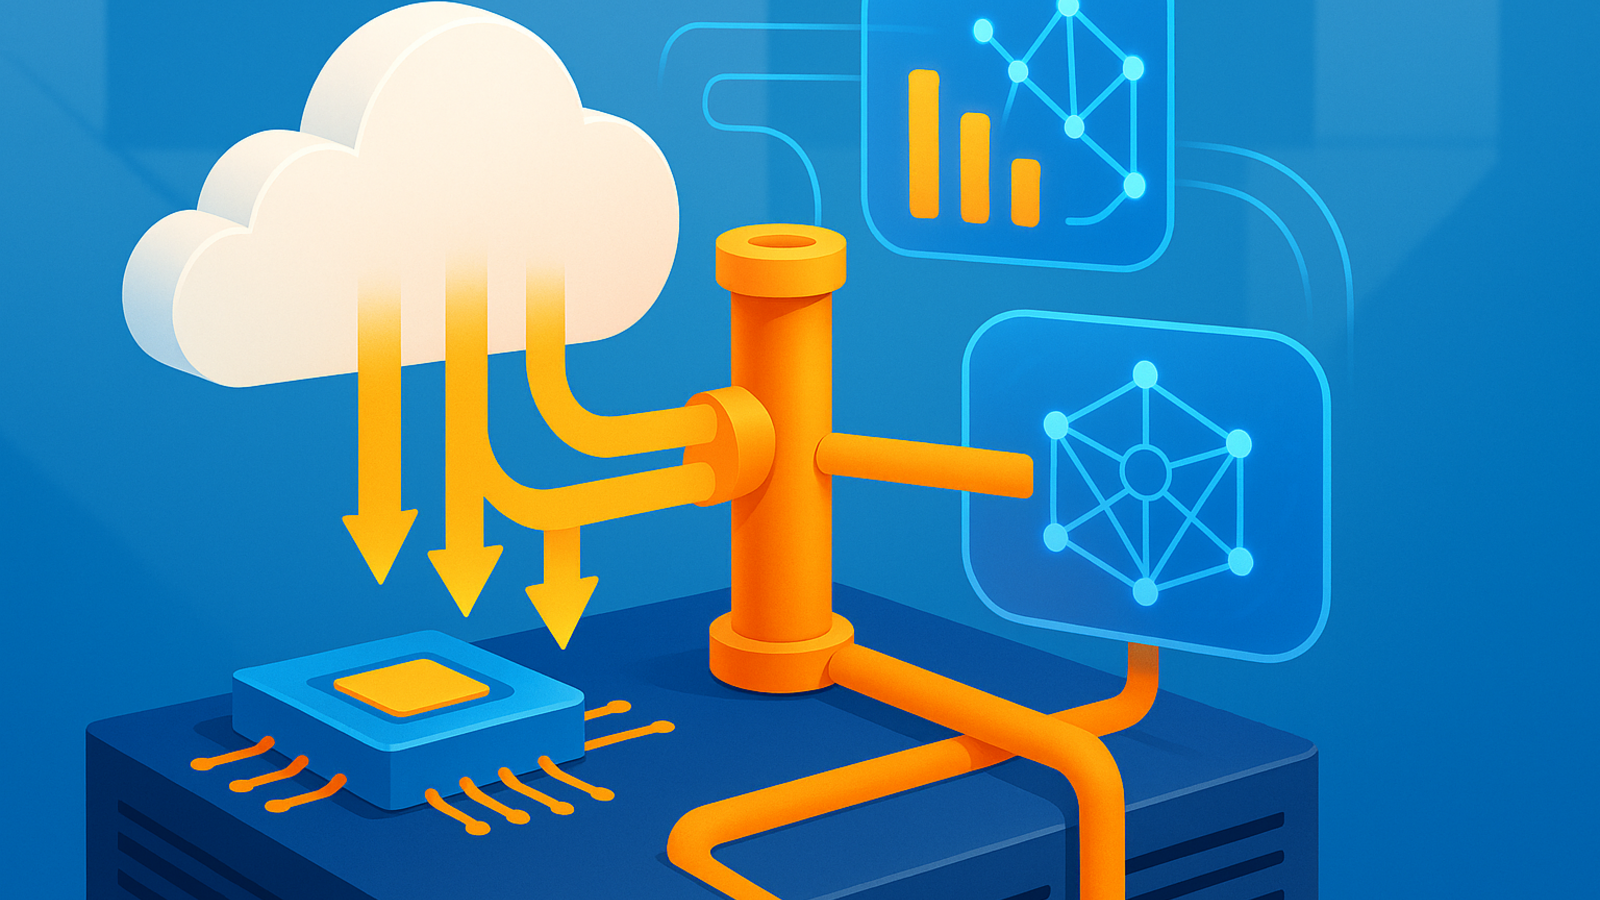
The Cloud Native Computing Foundation (CNCF) announced on May 21, 2026, that OpenTelemetry has graduated — a milestone that cements the project as the de facto standard for observability across cloud native infrastructure. The news arrived during the Observability Summit in Minneapolis, and it signals more than just a project maturation badge. It reflects how the industry has fundamentally converged on a single, vendor-neutral way to collect, process, and export telemetry data.
For platform engineers and SREs managing distributed systems, this graduation matters because it removes ambiguity. When a CNCF project reaches graduated status, it has demonstrated widespread production adoption, healthy governance, documented security practices, and a sustainable contributor base. OpenTelemetry checks every box — and then some.

What Graduation Means for the Ecosystem
OpenTelemetry was formed in 2019 through the merger of OpenTracing and OpenCensus, two competing projects that had fragmented the observability community. The goal was simple: unify traces, metrics, and logs under a single set of APIs, SDKs, and semantic conventions so organizations could instrument once and route telemetry anywhere.
Seven years later, the results are striking. OpenTelemetry now has over 12,000 contributors from more than 2,800 companies, making it the second-most active project in the CNCF ecosystem by velocity — second only to Kubernetes. The OpenTelemetry JavaScript API package has been downloaded more than 1.36 billion times, and the Python API package has surpassed 1.3 billion downloads, with both setting new monthly records in April 2026.
The graduation also validates OpenTelemetry’s architecture. The project provides language-specific SDKs, auto-instrumentation libraries, the OpenTelemetry Collector for receiving and exporting telemetry, and semantic conventions that standardize what metadata gets attached to spans, metrics, and logs. This stack is now embedded in everything from Kubernetes clusters to serverless functions to browser applications.
As Chris Aniszczyk, CTO of CNCF, put it: “OpenTelemetry’s graduation solidifies it as the essential, unified observability standard, providing the consistent visibility required to understand and oversee complex systems.”
What Graduation Actually Requires
CNCF graduation is not a marketing label. It is a rigorous process with defined criteria. A project must demonstrate widespread production adoption across multiple organizations, have a healthy and diverse contributor base, document its security practices and threat model, and maintain stable governance structures. OpenTelemetry met these thresholds years ago in practice, but the formal graduation at KubeCon + CloudNativeCon Observability Summit 2026 makes it official.
The timing is notable. Observability is shifting from a reactive debugging tool to a proactive platform capability. Organizations are using telemetry data to drive automated scaling, canary analysis, cost attribution, and security anomaly detection. OpenTelemetry’s graduation gives these advanced use cases a stable foundation — one that vendors, cloud providers, and internal platform teams can build on with confidence.
The Business Case for Standardization
Before OpenTelemetry, organizations faced a familiar trap. They would instrument applications with vendor-specific agents, build dashboards and alerts around that data model, and then find themselves locked into pricing structures or feature roadmaps that did not match their needs. Migrating meant re-instrumenting every service, a cost most teams could not justify.
OpenTelemetry breaks that cycle. By separating instrumentation from backend storage and analysis, it introduces genuine portability. A team running Prometheus and Grafana today can evaluate a managed observability platform tomorrow without touching application code. The same telemetry pipelines that feed internal dashboards can also feed ML-driven anomaly detection, capacity planning models, or compliance audit trails.
This separation of concerns mirrors what Kubernetes did for compute workloads. Just as Kubernetes abstracted the container runtime from the infrastructure provider, OpenTelemetry abstracts the telemetry producer from the observability consumer. The parallel is not accidental — both projects share the same CNCF graduation status and similar velocity metrics.
The Expanding Observability Landscape
OpenTelemetry’s graduation is not happening in isolation. The broader observability and cloud native testing ecosystem is evolving rapidly around it, with several notable releases and frameworks landing in the same window.
k6 2.0 and the Agentic Testing Shift
Grafana Labs released k6 2.0 on May 12, 2026, adding a set of features that reflect how AI is reshaping developer workflows. k6, already one of the most widely used open source performance testing tools with over 30,000 GitHub stars, now includes commands designed specifically for agentic AI workflows.
The new k6 x agent command bootstraps testing setups for AI coding assistants like Claude Code, Codex, and Cursor. k6 x mcp exposes k6 through a built-in Model Context Protocol server, allowing compatible agents to validate scripts, inspect results, and iterate without leaving their session. Combined with k6 x docs and k6 x explore, the tool effectively becomes an extension of an AI agent’s testing capabilities.
This is significant because it illustrates how observability and testing are converging with AI infrastructure. Performance testing is no longer a separate phase — it is becoming an integrated part of the agentic development loop, where AI writes code, tests it, and refines based on telemetry.
Prometheus 3.12 Prepares for Release
The Prometheus project published version 3.12.0-rc.0 on May 19, 2026, with a mix of security fixes, PromQL enhancements, and performance improvements. Two security vulnerabilities were patched: a denial-of-service issue in remote-write snappy decompression and a secret exposure leak in STACKIT service discovery. The release also introduces experimental PromQL functions — start(), end(), range(), and step() — alongside optimizations to TSDB head chunk lookups that reduce CPU usage.
Prometheus remains the backbone of metrics collection in cloud native environments, and its continued evolution alongside OpenTelemetry reinforces the multi-signal observability stack that CNCF projects have built. Metrics from Prometheus, traces from OpenTelemetry, and logs from Fluentd or Fluent Bit form the standard telemetry pipeline that platform teams now expect.
CNCF Publishes Ingress Tracing Framework for SaaS
On May 22, 2026, the CNCF Technical Advisory Group published a framework for end-to-end ingress request tracing in multi-tenant SaaS platforms. The guidance addresses a practical gap that many platform operators face: a single customer request may traverse dozens of microservices, but without consistent trace context propagation, failures become isolated incidents rather than connected narratives.
The framework builds directly on OpenTelemetry and W3C Trace Context standards. It recommends that every ingress request carry a trace identifier, that services preserve the trace ID across downstream calls, and that retry operations maintain the original trace context while generating new span IDs. This creates a deterministic, hierarchical view of request flow that transforms incident response from log-guessing into trace-driven diagnosis.
For teams operating Kubernetes-based SaaS platforms, this guidance offers a product-led approach to distributed tracing — treating it as a first-class platform capability rather than a per-service implementation choice.
GenAI Observability Becomes a First-Class Concern
OpenTelemetry’s reach is also expanding into AI workloads. The project’s Semantic Conventions for Generative AI now standardize how LLM operations are recorded — capturing model names, input and output token counts, finish reasons, and (when opted in) full prompt and completion content.
Major coding assistants have already integrated these conventions. VS Code Copilot emits OpenTelemetry traces, metrics, and events for every agent interaction. OpenAI Codex exports structured log events and OTel metrics for API requests and tool calls. Claude Code provides metrics and log events via OpenTelemetry, with trace support in beta. The Aspire Dashboard, a free open source telemetry viewer from Microsoft, now provides a built-in GenAI visualizer for exploring these traces locally.
This matters because AI agents are becoming infrastructure components. When an agent takes 45 seconds to answer a question, platform operators need to know whether the delay is in the model, a tool call, or a retry loop. OpenTelemetry provides that visibility.
Why This Moment Matters
The confluence of these developments — OpenTelemetry’s graduation, k6’s agentic testing pivot, Prometheus’s continued maturation, and the emergence of GenAI observability conventions — points to a larger trend. Observability is no longer a niche concern for large SRE teams. It is becoming the default operating model for cloud native platforms, embedded into the development lifecycle from code generation to production debugging.
Cloud providers are reinforcing this shift. Microsoft documents OTLP ingestion for Azure Monitor across AKS, VMs, and Azure Arc-enabled servers. AWS has added OpenTelemetry metrics support for CloudWatch and Amazon EKS Container Insights. Google Cloud supports OTLP for Cloud Trace, Cloud Monitoring, and Google Cloud Observability. The protocol is becoming as standard as HTTP for moving operational data.
Organizations running Kubernetes, serverless, or hybrid workloads no longer need to choose between vendor-specific instrumentation libraries. They can instrument with OpenTelemetry, collect with the OpenTelemetry Collector, and route to whichever backend fits their needs — whether that is a managed cloud service, an open source stack like Prometheus and Grafana, or a commercial platform like Datadog or New Relic.
Looking Ahead
OpenTelemetry’s graduation is not a finish line. The project continues to expand its language support — Kotlin was recently added — and its Profiles signal is now officially in alpha. The community is also deepening integration with the broader CNCF observability ecosystem, including Kubernetes, Fluentd, Jaeger, and Prometheus.
For platform engineers, the message is straightforward: if you have not standardized on OpenTelemetry for telemetry collection, the ecosystem has now made that decision for you. The tooling, the vendor support, the community momentum, and the production validation are all aligned.
The cloud native observability stack is no longer a set of competing options. It is a coherent platform, and OpenTelemetry sits at its center.
Sources
- CNCF: OpenTelemetry Graduation Announcement
- OpenTelemetry Blog: OpenTelemetry is a CNCF Graduated Project
- Virtualization Review: OpenTelemetry Pushes Deeper into Cloud Observability
- Grafana Blog: k6 2.0 Release — AI-assisted Testing
- Prometheus v3.12.0-rc.0 Release Notes
- CNCF Blog: Designing End-to-End Ingress Request Tracing for Multi-Tenant SaaS
- OpenTelemetry Blog: GenAI Observability with OpenTelemetry

